MiniMeters answers the quiet frustration of mixing with your ears alone — giving you a real-time visual readout of what your audio is actually doing.
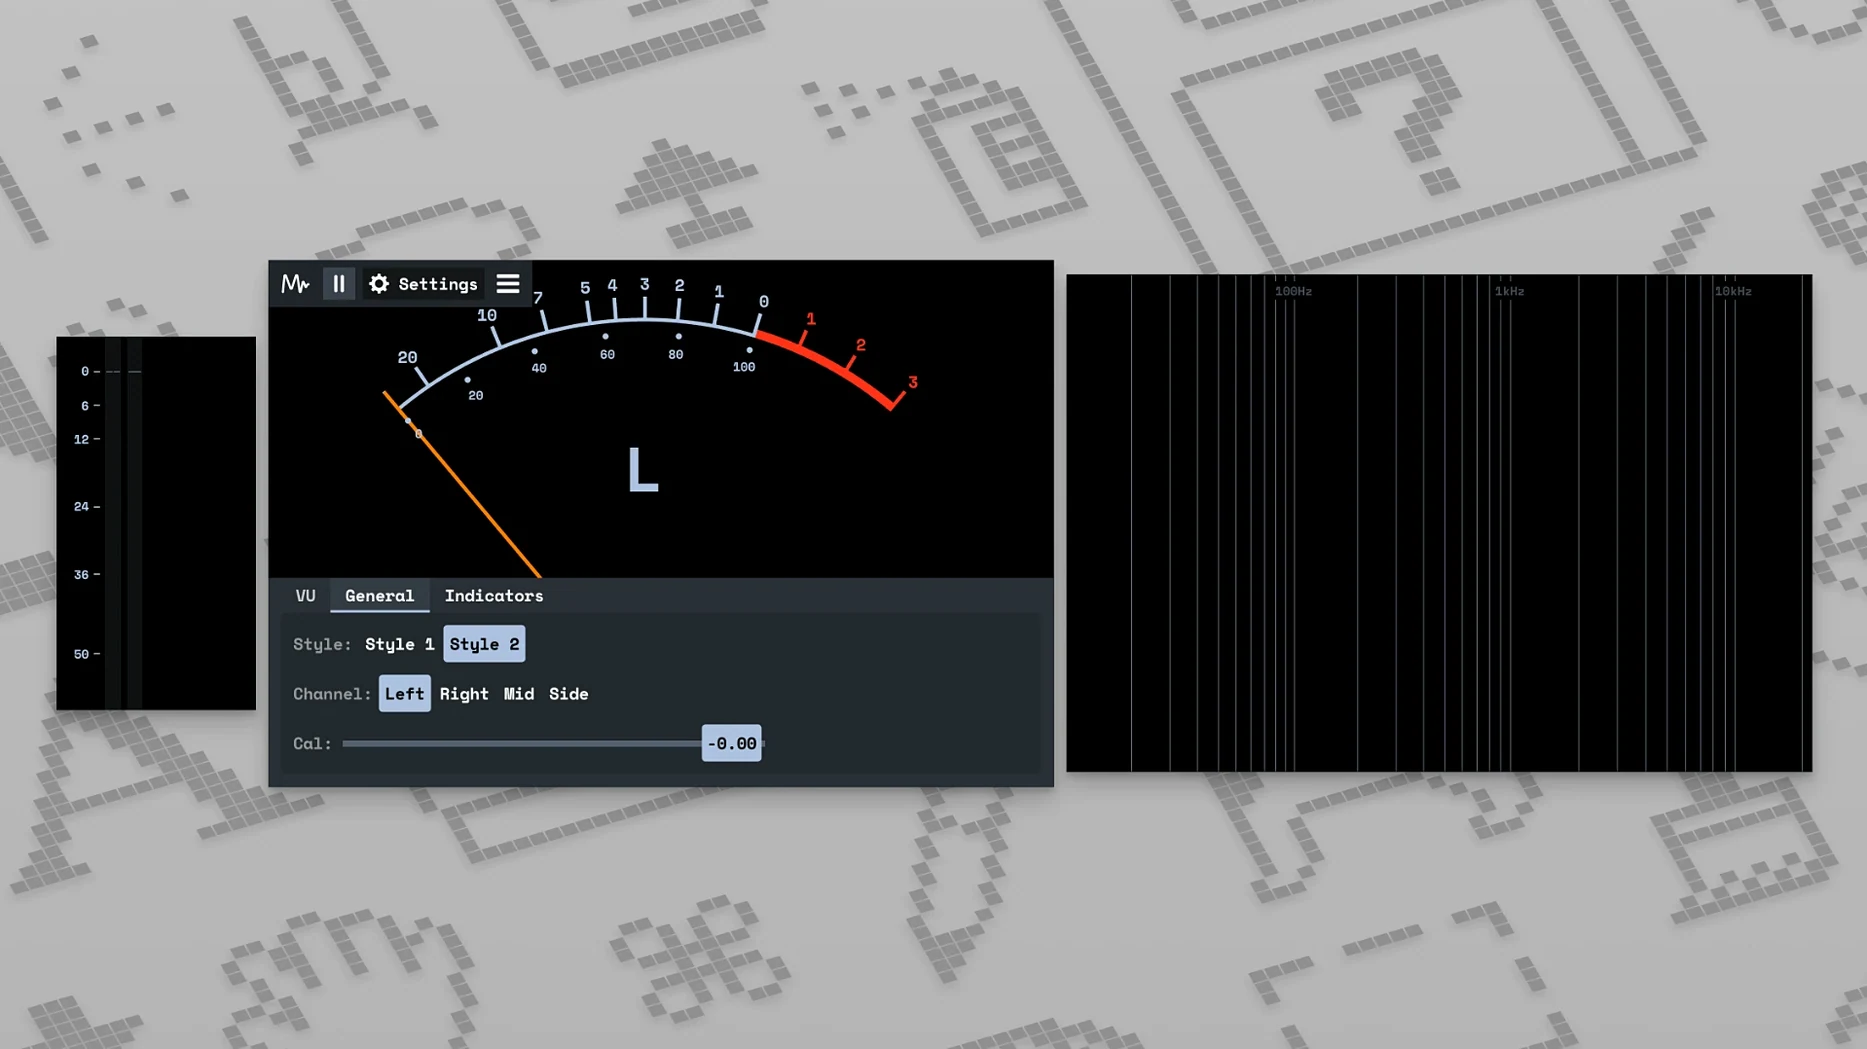
Volume meter — a resizable bar that shows momentary and short-term loudness, so you can catch peaks before they clip.
LUFS meter — displays integrated and peak loudness, the measurement that matters when you are comparing your track against a reference.
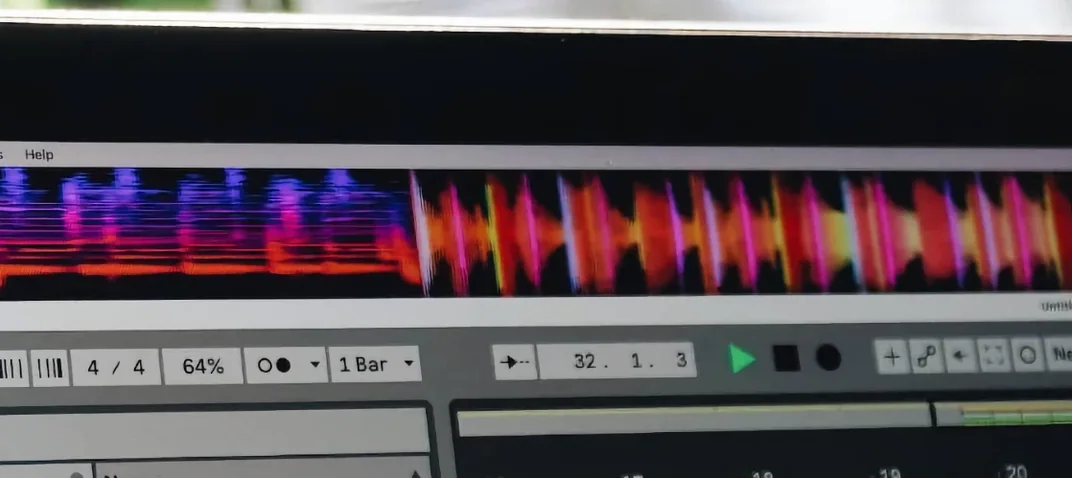
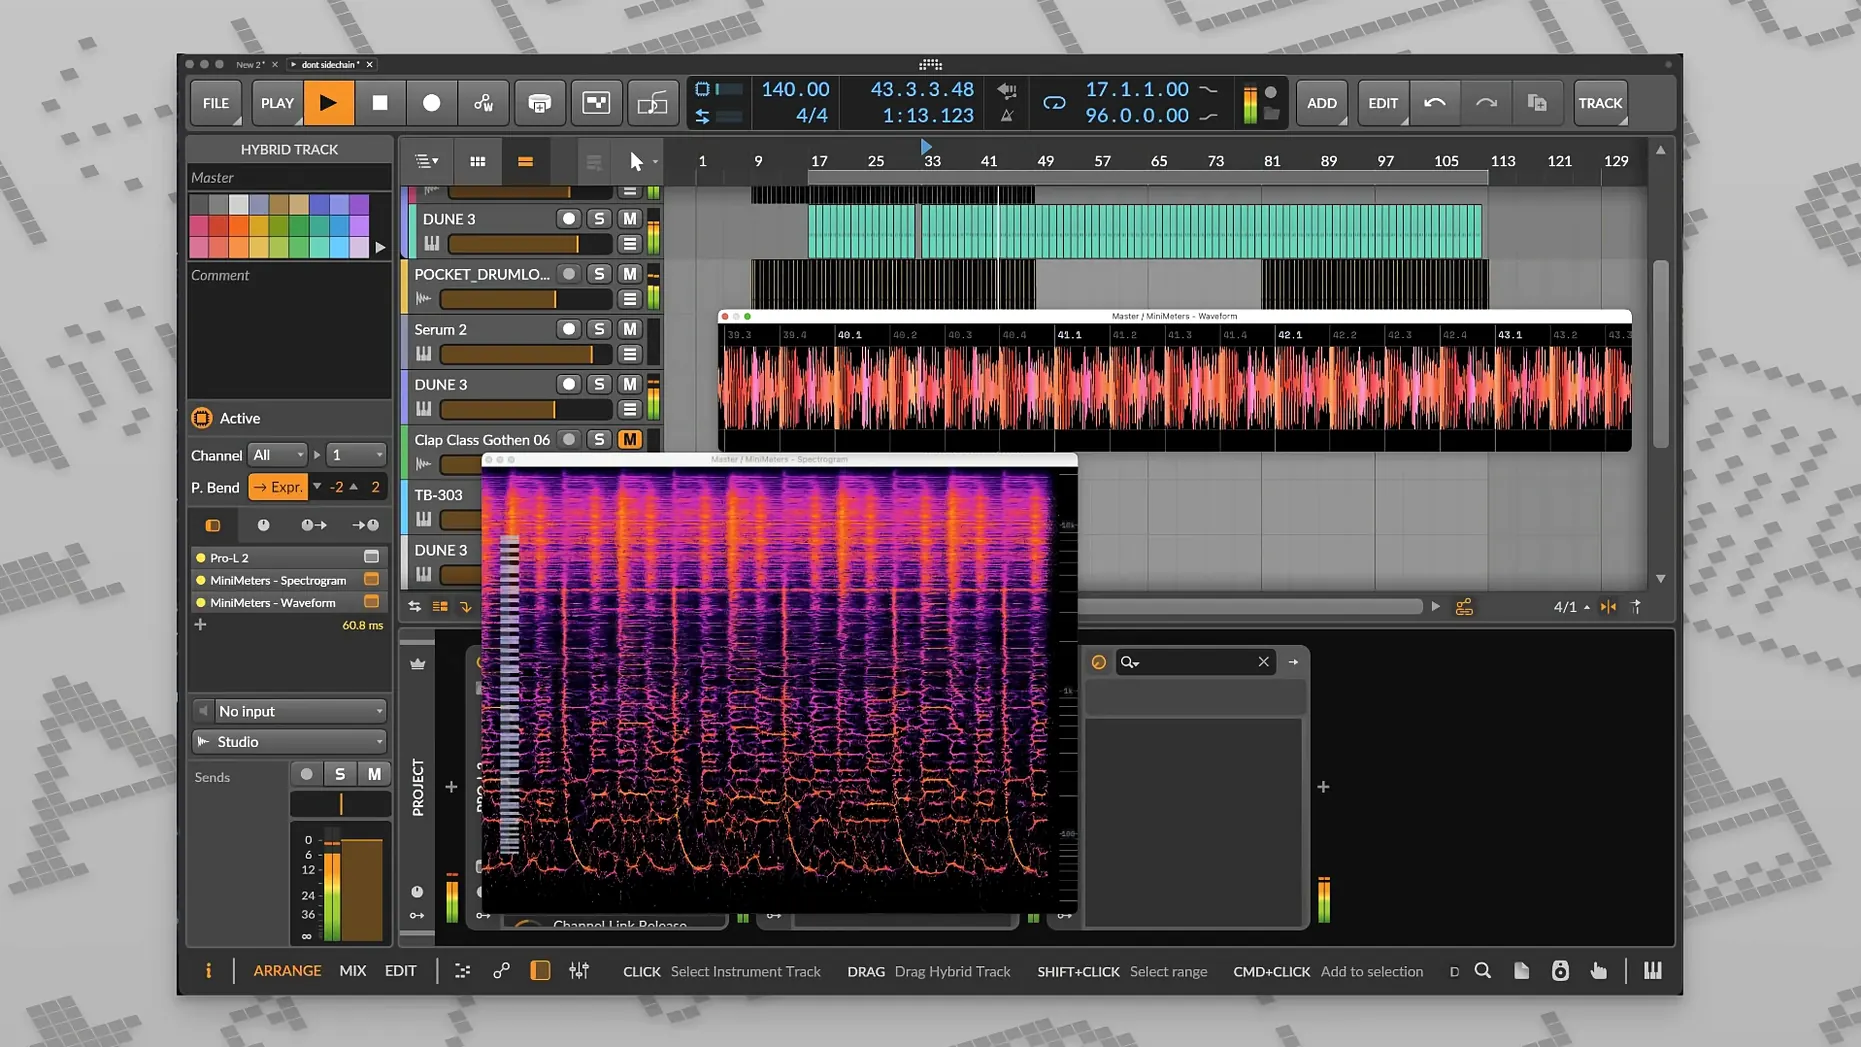
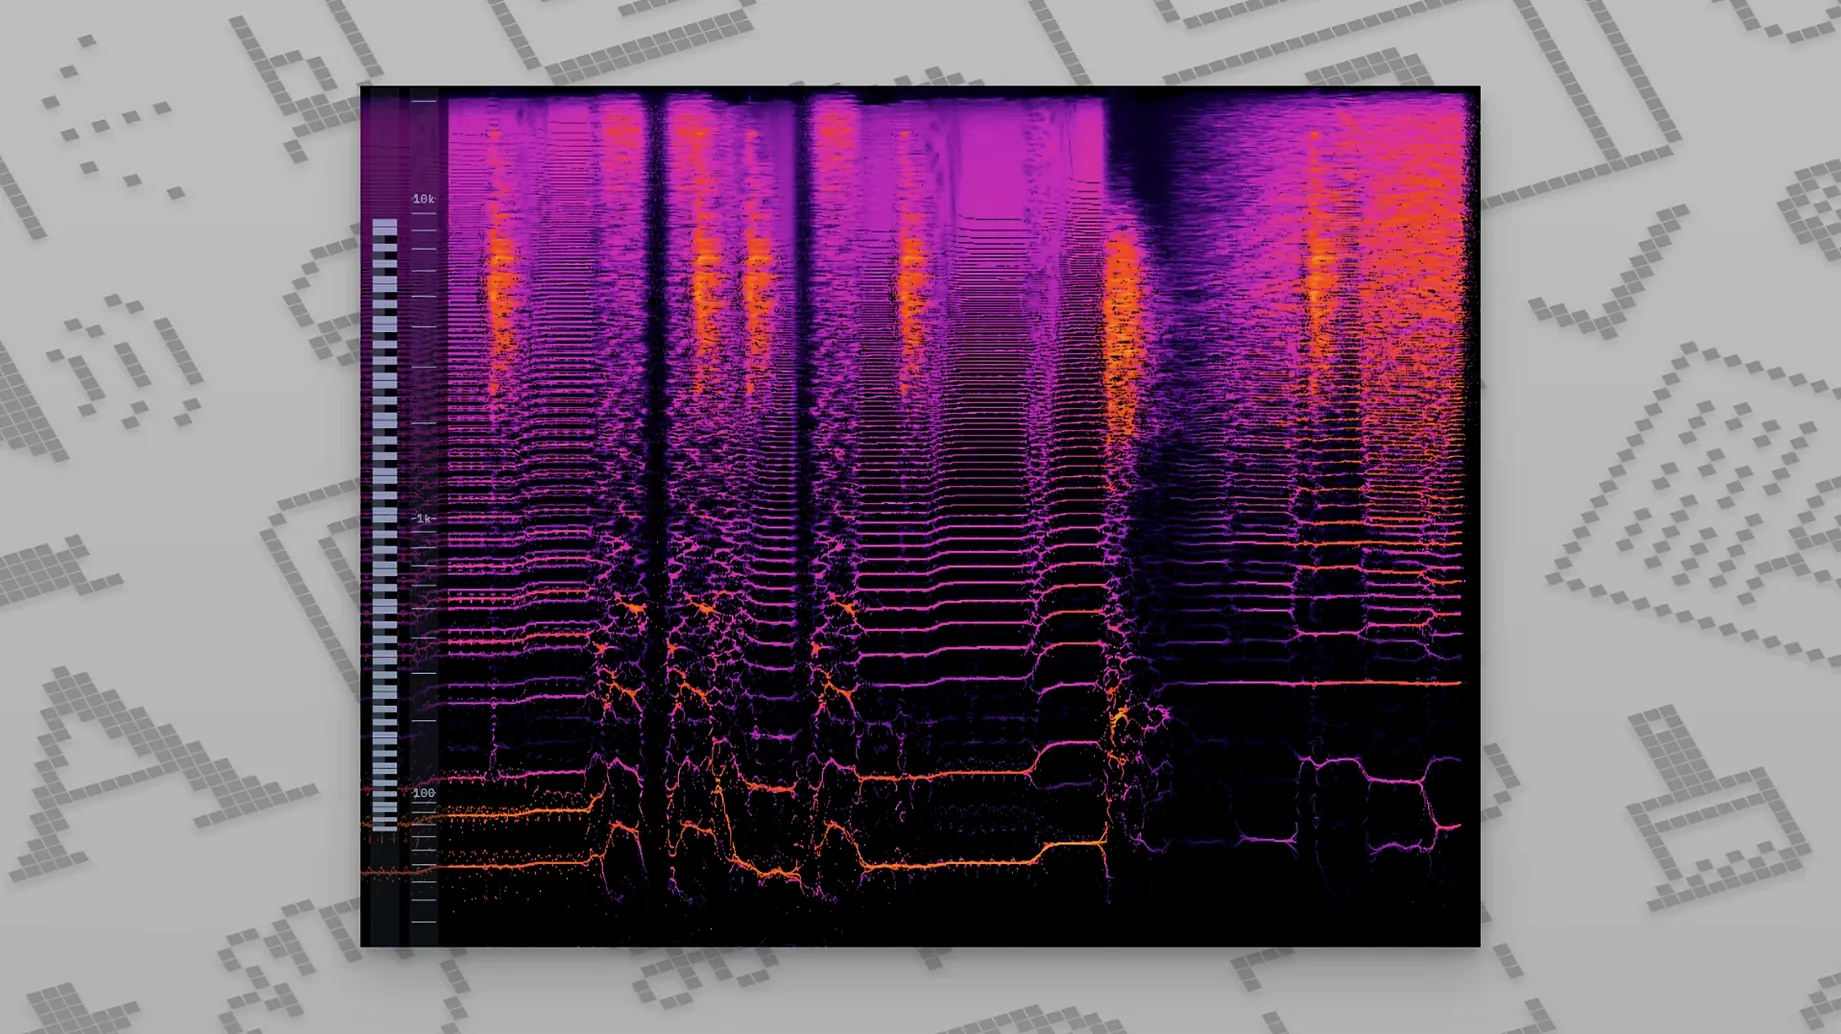
Spectrogram — a scrolling heatmap of frequencies over time, added in v0.8.0, useful for spotting resonant build-up or gaps in a mix.
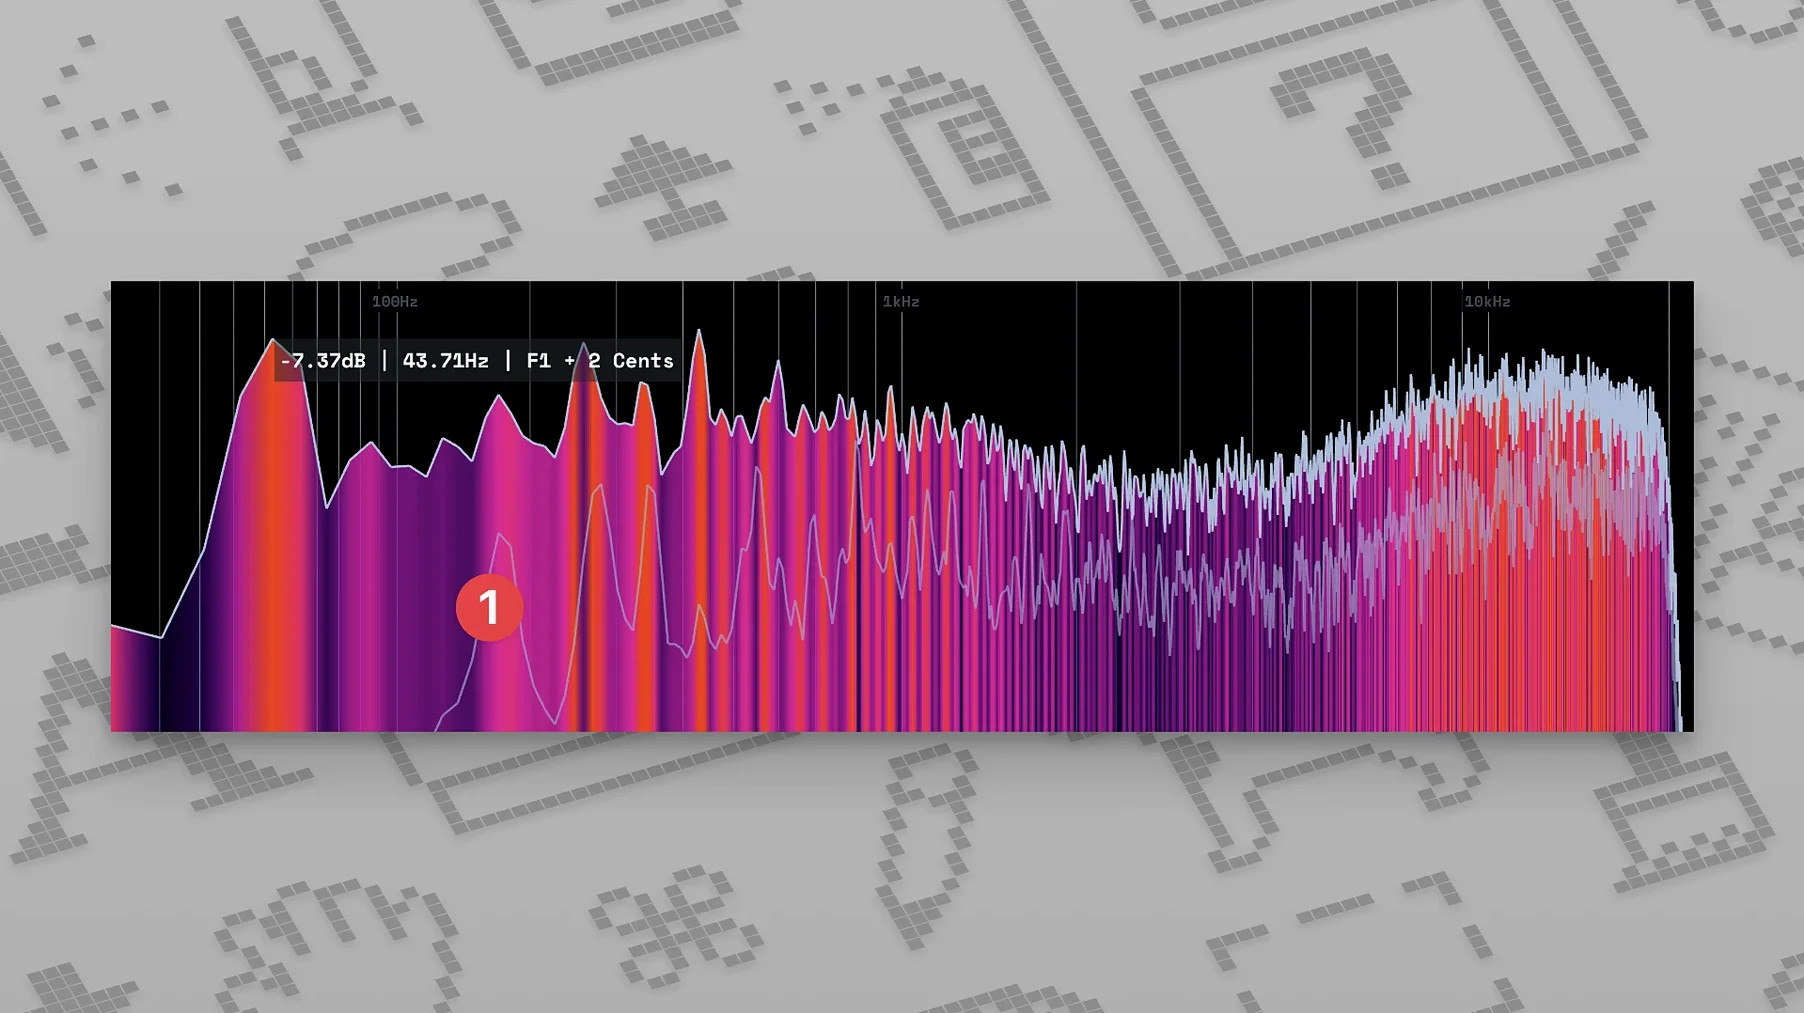
Frequency spectrum — a live bar-chart view of the frequency balance, letting you see the tonal shape at a glance.
Waveform display — the familiar oscilloscope-style trace, helpful for checking transients and overall dynamic shape.
Every panel lives in a single compact window. You can pick which tools are visible, change the colours, and rearrange the layout until the information lands the way you need it. Run it as a standalone app to monitor system audio while you listen to reference tracks, or load it as a plug-in inside your DAW.
Fitting MiniMeters into a real workflow
The standalone app works straight out of the box — open it and it grabs whatever audio is playing through your system output. That makes it genuinely useful even when you are not producing. Drag a reference track into your music player, set MiniMeters to float above other windows, and you have a live visual benchmark while you tweak your own session in the DAW below. No routing, no extra configuration.
For DAW work, the setup is slightly different. MiniMeters relies on a companion piece called MiniMetersServer, which acts as a bridge between your audio software and the meter display. You load the server as a plug-in on your master bus or any track you want to monitor, and it pipes the signal across. Once the server is running, the main MiniMeters app receives that feed and draws the visuals in real time. The separation is deliberate — the server handles the audio transport, and the app handles the display, so neither one bogs down your session with too much to do at once. In Logic Pro, Ableton Live, or REAPER, it slots in like any other AU or VST3 plug-in, and the connection is automatic once both pieces are open.
On the macOS side, there is a small integration worth knowing about: MiniMeters respects system appearance settings, so if you switch between light and dark mode, the interface follows along without needing a manual toggle. The window also supports native full-screen and Split View, which means you can pin the meters alongside your DAW on an ultrawide display or a second monitor without wrestling with window management.
Troubleshooting the things that trip people up
The most common snag is silence on the meters when the server plug-in is definitely loaded and audio is definitely playing. Nine times out of ten, the MiniMetersServer plug-in and the main MiniMeters app are not talking to each other. The fix is usually simple: quit both, launch the main app first, then open your DAW and insert the server plug-in. The connection handshake happens on launch, and the order matters more than the documentation lets on.
Another recurring issue is the standalone app picking up the wrong audio device — especially on Macs with multiple interfaces, aggregate devices, or external soundcards. If the meters are showing audio from Spotify when you meant to monitor your DAW output, check the audio input source in MiniMeters preferences. It defaults to the system output, but you can point it at a specific device or a loopback routing tool like BlackHole if you need more control.
On Apple Silicon Macs, the plug-in runs natively under ARM64, but if your DAW is running in Rosetta mode, the server plug-in needs to match. The installer places both architectures, and macOS picks the right one, but users who force their DAW into Intel mode occasionally see the server fail to appear in the plug-in list. Switching the DAW to native ARM or reinstalling the plug-in after changing modes usually clears it up.
CPU usage is worth a mention. The spectrogram and waveform displays redraw constantly, and on older Intel machines — particularly pre-2018 MacBook Airs — they can nudge the fan into action if you have several panels open at once. Reducing the window size helps, since MiniMeters scales its render load to the pixel dimensions of the display. Disabling the spectrogram panel is the single biggest CPU saver if things get warm.
What the releases actually changed
Version 0.7.0 brought the LUFS meter into spec compliance with ITU-R BS.1770, which meant integrated loudness readings finally matched what streaming platforms use for normalization. Before that update, the numbers were approximate and not reliable for mastering decisions — now they are directly comparable with measurements from tools like Youlean Loudness Meter or iZotope Insight.
The v0.8.0 spectrogram addition was the other milestone. A scrolling frequency-over-time heatmap filled a gap that the static spectrum display could not address: showing how long a resonant frequency lingers, or whether a low-end swell builds and decays cleanly. It turned MiniMeters from a set of snapshot meters into something that shows movement, which matters enormously when you are diagnosing muddy low mids or a hi-hat frequency that rings too long.
The jump to 1.0 in August 2025 was largely about stability — the features were already there. What changed in daily use was reliability. Plug-in scanning stopped failing on certain AU validation setups, the server connection became less finicky after sleep/wake cycles, and the window stopped forgetting its size between sessions. The v1.0.30 update that followed cleaned up leftover UI glitches: panel borders rendering one pixel off on scaled Retina displays, colour picker values not sticking after a restart, and a rare crash when resizing the window during spectrogram playback.
Fast mixers lean on the spectrum for dense arrangements
Mixing engineers who work fast and rely on visual cross-checks get the most mileage. When you are balancing a dense arrangement — say a rock track with layered guitars, stacked vocals, and a busy drum bus — the frequency spectrum catches masking problems that your ears might miss after two hours of listening fatigue. The LUFS meter gives you a running target for streaming loudness without needing to export and measure separately.
Mastering engineers gravitate toward MiniMeters for referencing. The ability to run it standalone while playing a reference track through Apple Music or QuickTime means you can A/B visually without routing anything through your mastering chain. The spectrogram becomes a forensic tool here — comparing the frequency decay of your track against the reference reveals compression differences that peak meters alone would never show.
Bedroom producers and self-taught musicians benefit in a different way. Visual feedback shortens the learning curve between hearing something wrong and knowing what to call it. Seeing a low-end bump on the spectrum while the kick and bass clash turns an abstract problem into something you can point at and fix. The compact, single-window design means it does not demand a second monitor or a complicated template — it just sits there and reports the truth, track after track.
Version 1.0.30.358 tidies up a handful of long-standing bugs and small interface glitches — the kind of fixes that make the meters feel more dependable session after session.
- macOS 10.15 or newer
- Intel or Apple Silicon Mac