
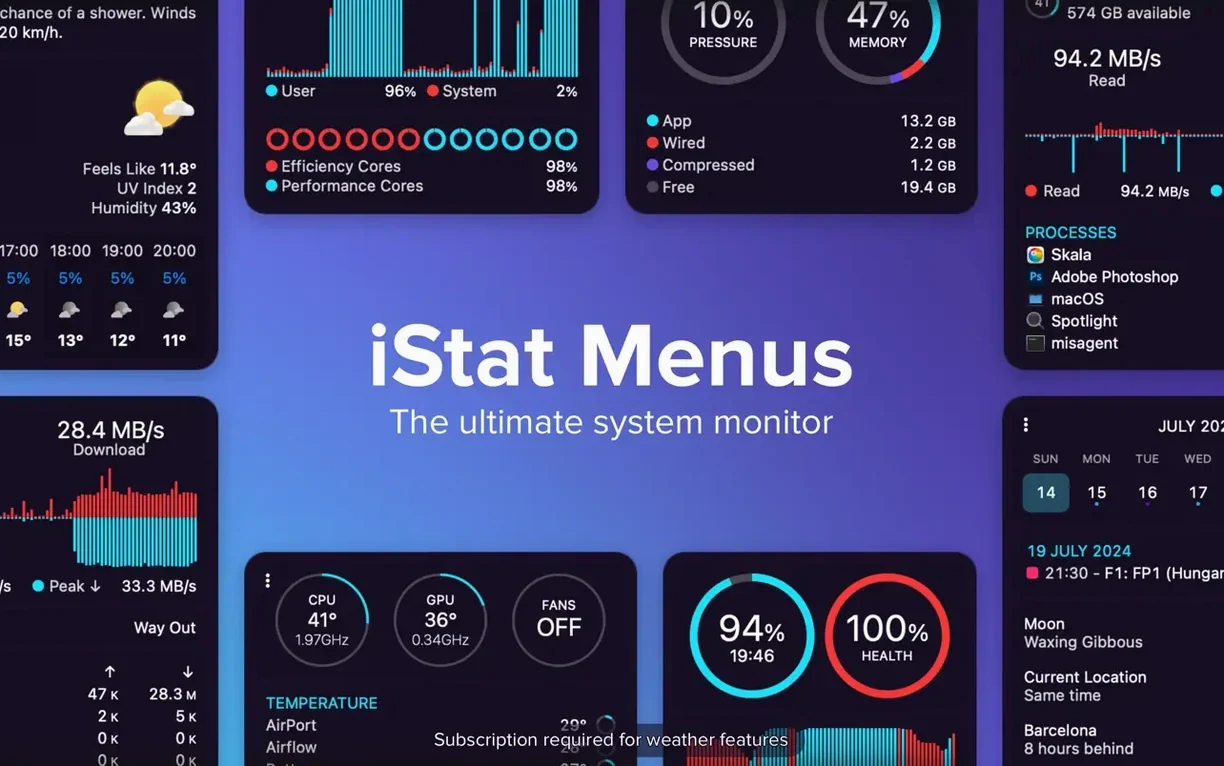
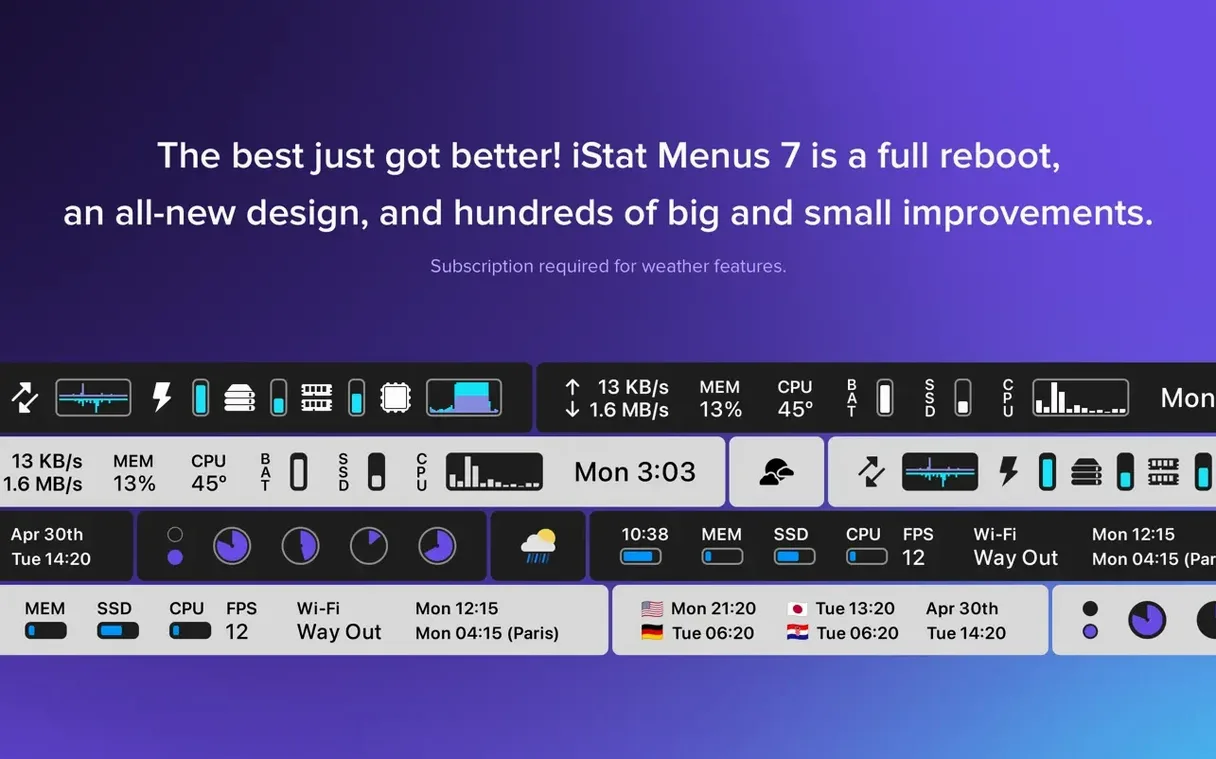
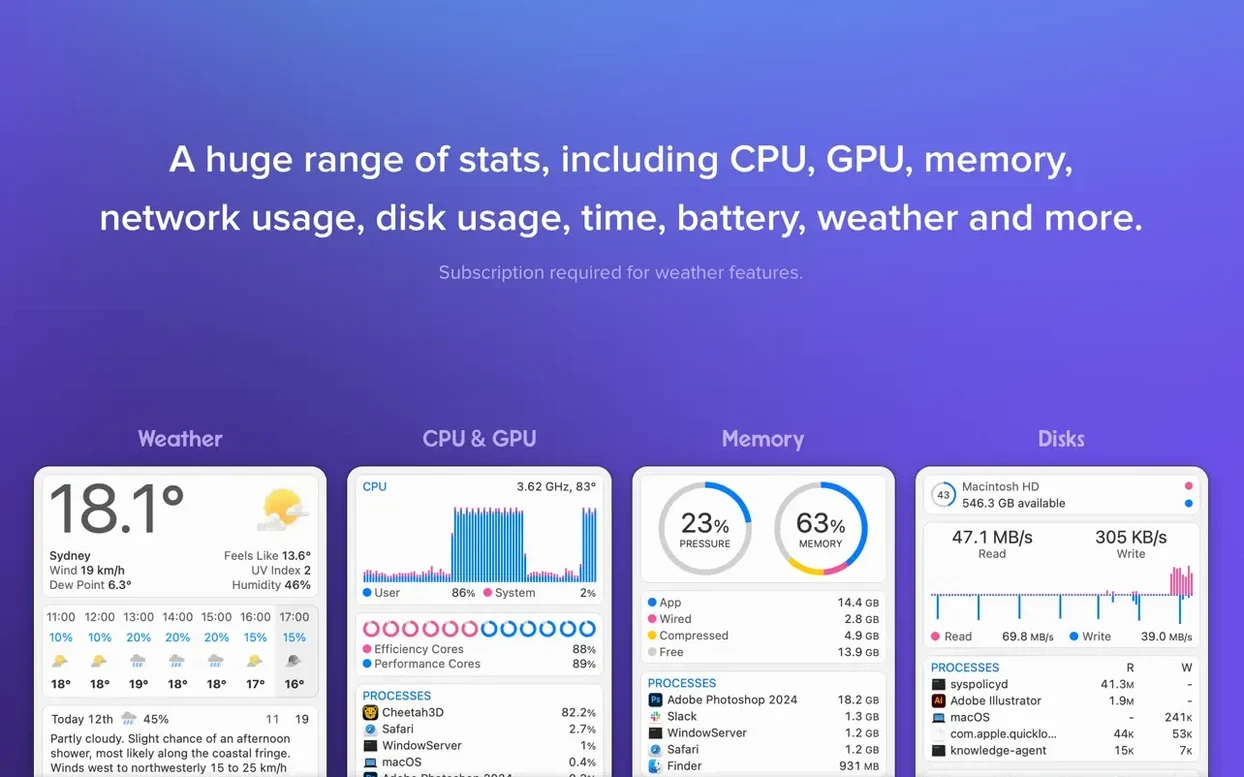
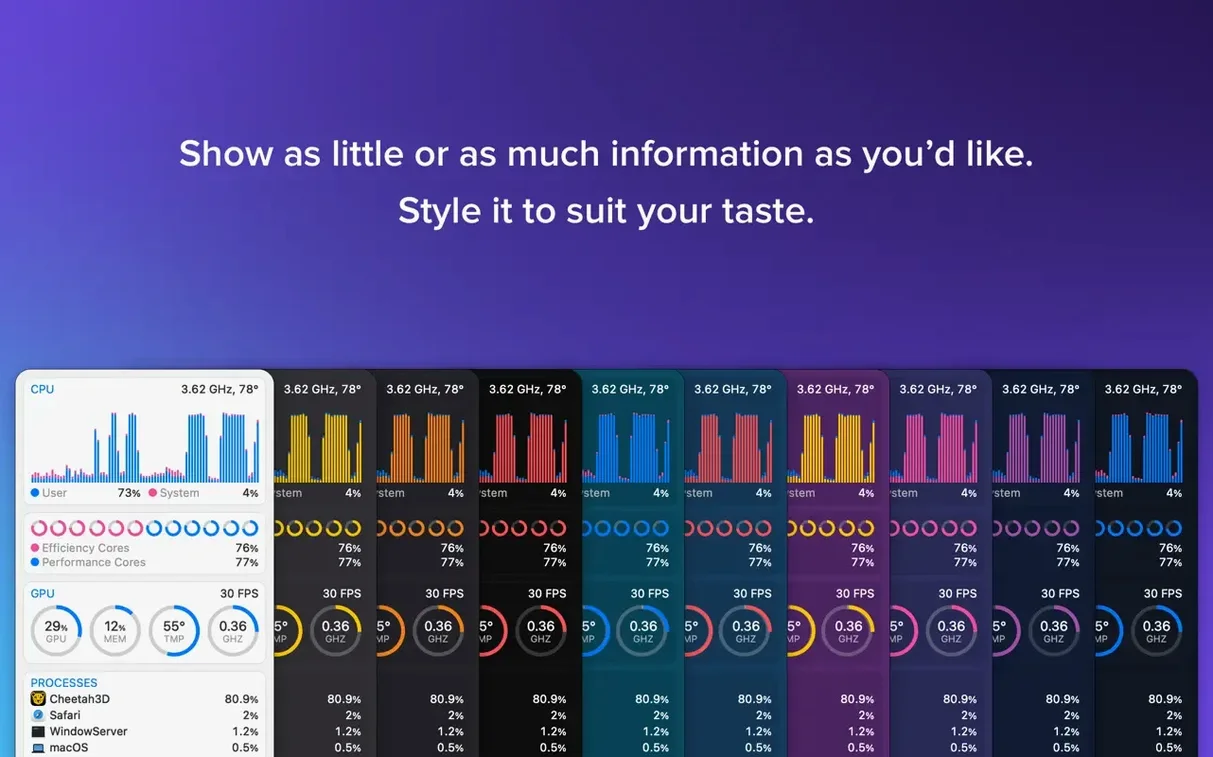
I know a few DITs who won't step onto a set without iStat Menus running. Not because they're troubleshooting, but because they want to see exactly how hard the machine is breathing during a multi-camera ingest. It sits in the menu bar as a quiet, infinitely configurable dashboard — CPU load rendered as a tiny graph, memory pressure as a pie chart, network throughput through each interface. The kind of data you glance at between takes, not something you open an app to find.
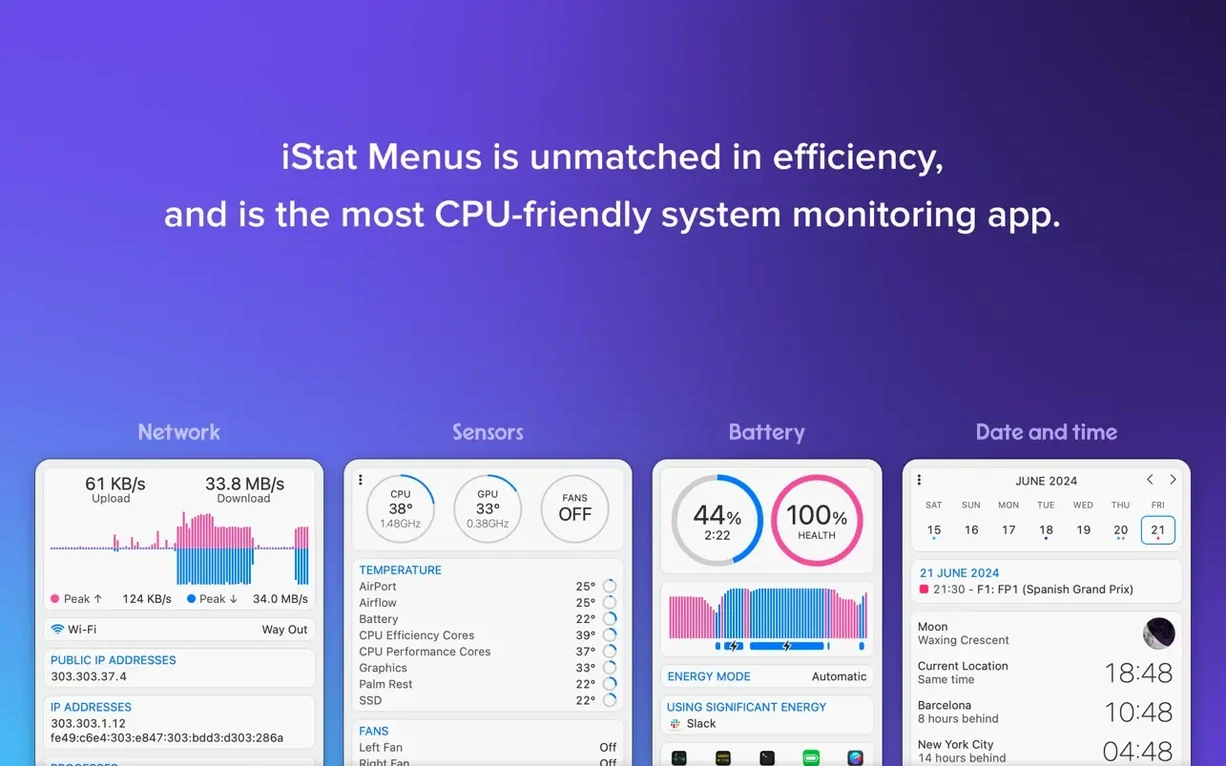
What keeps it installed on my own Mac is how deep the sensors reach. Beyond the usual CPU and RAM percentages, you can pull up per-core temperatures, SSD remaining life, power draw in watts, and fan speeds that you can actually govern with custom rules — say, a gentler curve when you're on battery and don't want the fans spinning up during a playback review. The network section breaks traffic down by application, so you can spot which background service is suddenly chatty while you're trying to keep a clean connection for a remote colour session.
Version 7.5 quietly expands into the sky. A new Astronomy item adds forecasts for seeing, transparency, and cloud cover — details that matter if you're planning a night exterior shoot and need to know whether the stars will hold. Combined with the existing weather, moon phase, and sunrise data, the menu bar becomes a compact location-scouting tool. It's a small addition, but it speaks to the philosophy here: surface the specialist data without making the interface feel crowded.
The Helper process handles the low-level sensor access, and the whole thing runs on Apple Silicon and Intel machines back to macOS 11. The interface localizes into over thirty languages, though the numbers read the same in every one of them.
Menu bar wakes before the Finder does
The working day starts clean. I log in and the menu bar populates itself before I've even opened a Finder window—CPU graph on the far right, a two-day weather forecast tucked beside the clock, network arrows already flickering as Mail does its morning sync. There's a small ritual I've fallen into. I click the CPU dropdown once, just to see the per-core load settle into idle, then swipe across to memory to check which apps survived the overnight backup script without leaking. It takes maybe ten seconds. Then I open DaVinci Resolve and watch the temperature sensors climb in a predictable curve as the GPU kicks in.
During a heavy render, the menu bar becomes a second monitor. I keep the disk activity indicator visible—a thin bar that pulses with writes—and the fan speed readout sits next to it. When the fans ramp past 4500 RPM, I know Resolve is deep into a noise-reduction pass and I should probably go make tea. The whole session feels conversational. The machine tells me what it's doing, and I adjust accordingly: closing a browser tab group that's eating memory, pausing a background sync before a colour-grade export, checking that the external SSD hasn't crept past 42 °C during a long transfer.
180 MB footprint on an M1 Max
iStat Menus itself is practically weightless. On an M1 Max with 32 GB of RAM, the combined processes—the app, the Helper, and the individual menu bar items—rarely exceed 180 MB of memory, and CPU time is a rounding error. I've seen it register 0.1% CPU over a twelve-hour stretch, most of that spent updating the clock widget every second. The Helper process runs quietly in the background, waking only to poll sensors, and I've never caught it blocking the system from sleeping or interfering with a render.
Stability is uneventful in the best way. Across two major macOS updates and countless point releases, the menu bar items have never vanished mid-session or redrawn themselves into a garbled mess—a problem I remember from older system-monitor utilities that hooked into the menu bar through less careful means. The only quirk I've noticed is that after a rapid user switch, the weather item occasionally needs a manual refresh, which is a single click on its dropdown. That's the worst of it.
Where Stats falls short of iStat Menus
Stats, the free and open-source menu bar monitor, covers similar ground with a flatter design language. It's fast, it's native on Apple Silicon, and it does the basics—CPU, GPU, RAM, network, temperatures—without asking for a Helper installation. What it doesn't offer is the deep configurability: no custom fan curves, no per-application network breakdown, no weather or astronomy modules. Stats feels like a snapshot; iStat Menus feels like a control surface.
Sensei sits further up the stack. It's part system monitor, part cleanup utility, with a gorgeous single-window design and detailed SSD health reporting. But it lives in a window, not the menu bar, and it wants to be opened. It's the app you launch when something feels wrong. iStat Menus is the companion that already knows something's wrong and has been quietly graphing it for the last twenty minutes.
MenuMeters, the venerable predecessor that inspired much of this category, still works through community builds, but its sensor access is limited on modern hardware and it can't touch the thermal or power-draw detail that the Helper enables. It remains beloved for its simplicity, but it hasn't kept pace with Apple's hardware reporting APIs.
a colour grade with the temperature in view
Here's a workflow that's become second nature. I have a 45-minute short film exported from Resolve as a single ProRes 4444 file, and I need to transcode it to a viewing copy with burned-in subtitles while simultaneously backing up the project to an external NVMe drive. Before I start, I open the disk activity dropdown and pin it—a single click on the icon—so I can see reads and writes in real time. The network section stays visible too, because I'm pulling the subtitle file from a shared folder on the local NAS.
I fire off the Compressor batch first. The CPU graph spikes to eight full cores, and the temperature sensors on the performance cluster climb from 38 °C to 74 °C over about ninety seconds. The fans, governed by the default Apple curve, spin up to 3200 RPM—audible but not distracting. I watch the disk writes hover around 800 MB/s as Compressor streams the output file to the internal SSD, and I start the Finder copy to the external drive only when that number dips below 200, so the two write-heavy tasks don't compete for the same controller.
Halfway through, the memory pressure chart shifts from green to amber. I check the per-app breakdown: Resolve left a background process holding 6 GB, and Safari has bloated to 4 GB across a dozen tabs. I quit the Resolve helper and close half the tabs without touching the transcodes. The pressure drops back to green within seconds. The whole operation finishes in eleven minutes, and the SSD never exceeded 51 °C. I know that because the graph is still there, a gentle slope returning to idle, and I close the dropdowns only when the fans spin down to silence.
Version 7.5 introduces a new Astronomy item that brings forecasts for seeing, transparency, and cloud cover into the menu bar — practical details for anyone timing an outdoor shoot around clear skies or steady air.
- macOS 11 or later
- Apple Silicon or Intel Mac
Questions from the booth
Yes, the iStat Menus Helper runs in the background to access low-level hardware sensors for temperatures, voltages, fan speeds, and power draw.
You can create fan speed rules that trigger specifically when the Mac is running on battery, letting you prioritize quieter operation over aggressive cooling.
It displays a detailed forecast, wind speed, dew point, sunrise and sunset times, moon phases, and with version 7.5 adds astronomical seeing, transparency, and cloud cover forecasts.